|
|
You are here: Foswiki>ELabs Web>FGCSSPCFPFGCS2013SI>MeetingMinutes>MeetingNotes20080305 (2008-03-25, LizQuigg)Edit Attach
Meeting Notes for 5 March 2008
Present: Liz, Tom L., Joao, Bob;Absemt: Eric, Dan K, Mike W., Randy., Kris, Mihael, Tom J.
Results from Workshops/Student Testing
St. Joe's Students
We have learned that we need to work on the documentation and perhaps change the length of time that an analysis sits in the queue. The problem with the ND students was exacerbated by the fact the Mihael restarted the server. The St. Joe’s students were using data with 15 million events (1 month ) of data from 4 different months (fall 2005 from St. Joe's); they ran in 5 different modes of execution. The machine did not crash and a lot of jobs executed. They noticed that using the same username, it is hard to tell the jobs apart. The students would click “run the study again” to look at the input parameters so they could determine which analysis it was. We need a way to recognize a job on the queue - how to distinguish them. ID number or something. Bob also wanted for the student to know where the job is running. (in Bugzilla) Tom would like to have an estimant of how long the job might take to run as he saw in the Ligo analyses. Is this something that Mihael can predict? 75% of the results went through for the St. Joe’s students, but then the rest of the results went away because of the 48 hour lifetime. The rest of the jobs that did not complete by Saturday morming could be caused by the networks issues (CI/UChicago maintenance) or by the unreliability of the grid. Tom Loughran would like to see the 2 day lifetime of jobs on the queue increased to 2 weeks. He wanted to know the footprint in memory of each job.Sendai, Japan and Southern California – analyses ran very well on Swift - Local in Japan. Analyses in So. Calif. ran well; they did not try grid.
We have some poster issues that Liz put in Bugzilla. Bob had problems with making posters in Japan, but is is not clear whether they had blocked pop-ups. Bob was wondering if it might be related to their being logged out beause they were inactive for a while. He thought it might have happened with IE. Another cause could be permissions problems. Liz is betting on "blocked pop-ups" because some of these showed up when viewing posters.Problem with saving plots on www18 and not seeing them on production.
Users in Hawaii trying www18 said they can save plots. but the thumbnails and plots don’t show up when they log into production.. Bob wondered if we should be broadcasting www18 for testing with this kind of problem. Liz thought the user areas might be different between the two or perhaps where thumbnails and plots are stored is different. If so, then the problem would go away when we went to www18 as production.Prerequisites for moving www18 to production status
- Fix editing capability for posters.
- Fix searching for posters
- Plots not showing in production when made in www18 (may go away when changing)
- Action.jsp - Add a warning there as well.
- List.jsp – add message “Your results will disappear in 48 hours so be sure to save any results as plots.
Joao's Report
Major Problem with using Gecko for web client in Amelia
Joao spent the last two weeks with problems related to this and will be putting off the implementation of the web client in Amelia until he can find a better cross-platform solution.Why Java
Joao asked why we use java. Liz said it was a decision made a few years ago by the UChicago/Argonne team. Joao pointed out that Sun is now working on integrating Python with java and diversifying. They are adding Python wrappers. Now rather than referring to the “Java Virtual Machine”, they are only referring to the “Virtual” machine. Joao is advocating diversifying the ways to implement e-Labs; Python is much faster. Liz also pointed out that Eric and Mihael had found ways to integrate php in the e-Lab although for the analyses, it would probably be better for people to use the tools that Mihael has developed for e-Labs which assume java.Diagram V2
Joao made a new diagram. Except for the i2u2 cluster not being parallel to the grid, this makes sense to everyone. -- Main.LizQuigg - 05 Mar 2008 * Atlas/Amelia e-Lab V2 Diagram: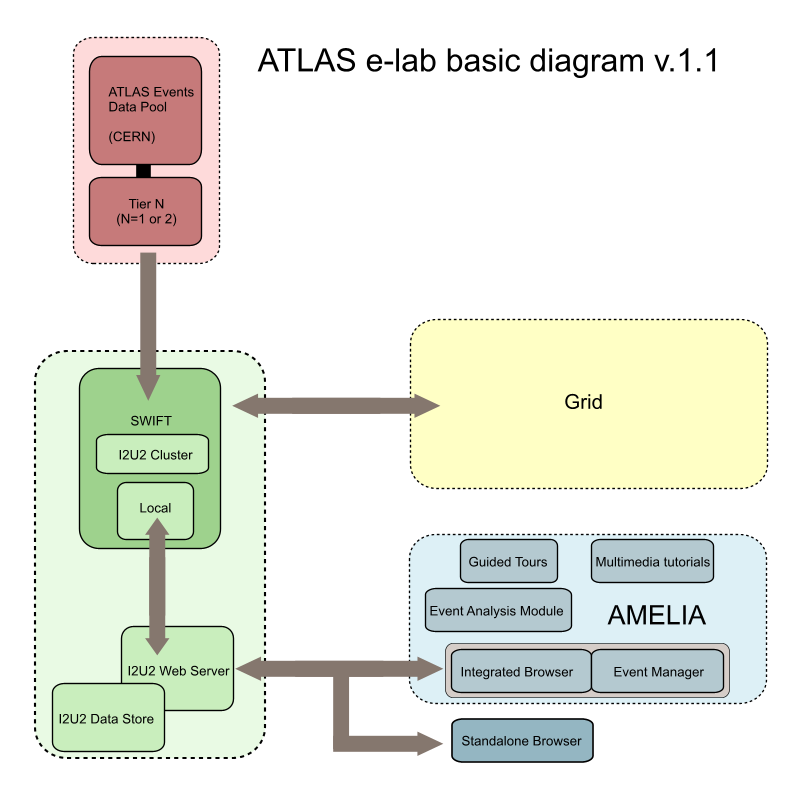


| I | Attachment | Action | Size | Date | Who | Comment |
|---|---|---|---|---|---|---|
| |
ATLAS_e-lab_scheme_v2.png | manage | 69 K | 2008-03-05 - 20:57 | Main.UnknownUser | Atlas/Amelia e-Lab V2 Diagram |
Edit | Attach | Print version | History: r6 < r5 < r4 < r3 | Backlinks | View wiki text | Edit wiki text | More topic actions
Topic revision: r6 - 2008-03-25, LizQuigg
Ideas, requests, problems regarding Foswiki? Send feedback